SoMeta
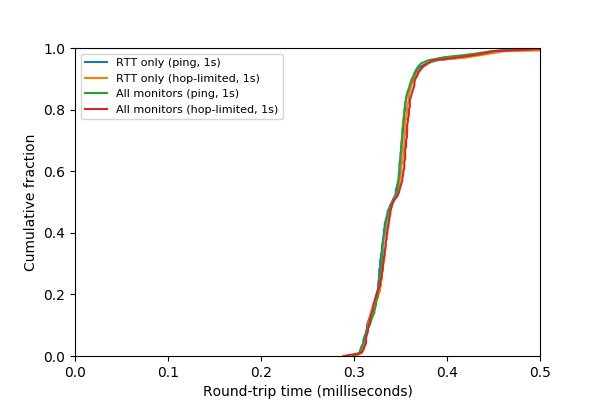
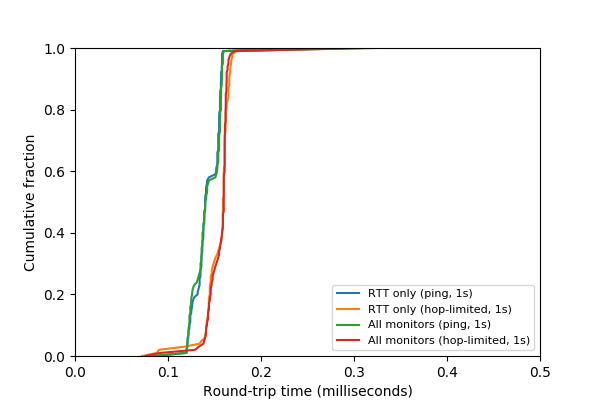
RTT performance overhead results.


RTT performance overhead results (Left: Raspberry Pi Model 1 B; Right: FreeBSD server)
To run the experiments and create the data, Benchmarks/baseline.sh was run on each system (with some minor adaptation to change the interface name)---specifically, on pib (known as pi1) and FreeBSD server. Corresponding json output files will be generated for each system.
To plot the graphs, use plot_baseline.py script and the data generated above.