SoMeta
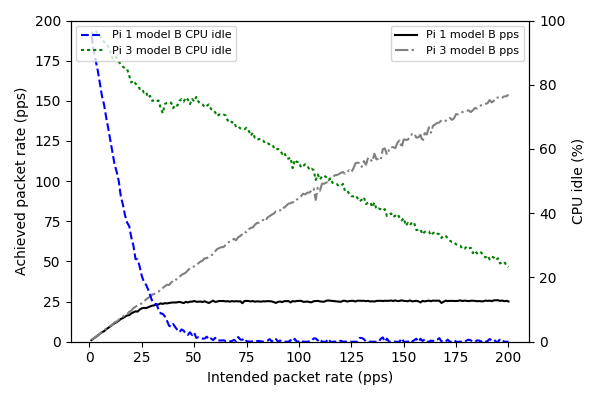
Probing rate results.

Performance of the Pi1 and Pi3 when configured for a range of probing rates
To generate the data, Benchmarks/rateSendTest.py was run on each system (i.e., pi1 and pi3).
To plot the data, send_microbench.sh is first executed, which produces two output files from analyzing the data files. Next, plot_microsend.py is run to produce the plot.